
Fiscal Transparency Portals:
Lessons from Latin America
Author: Aura Martínez, Coordinator for Knowledge and Technical Assistance and Collaboration, GIFT
September 2021
Ten Latin-American governments within the GIFT Network came together in late 2020 to create the Portals Working Group. The Working Group aims to share practical knowledge and build actionable solutions for governments to publish useful, quality information that assists the public in participating in the development of, and in monitoring the implementation of public policies. These countries, that engage each other through their government agencies tasked with publishing information on national spending and revenue, are: Argentina, Brazil, Chile, Colombia, Costa Rica, Dominican Republic, El Salvador, Guatemala, Mexico, and Uruguay. The Working Group is currently led by the Office of Planning and Budget of the Presidency of the Republic of Uruguay, and GIFT’s Coordination Team.
As its first order of business, in January of 2021, the Group completed an internal survey to determine the current state of Fiscal Transparency Portals (FTPs) in the region. In this blog, we present the summary results of this survey.
What topics are covered in portals?
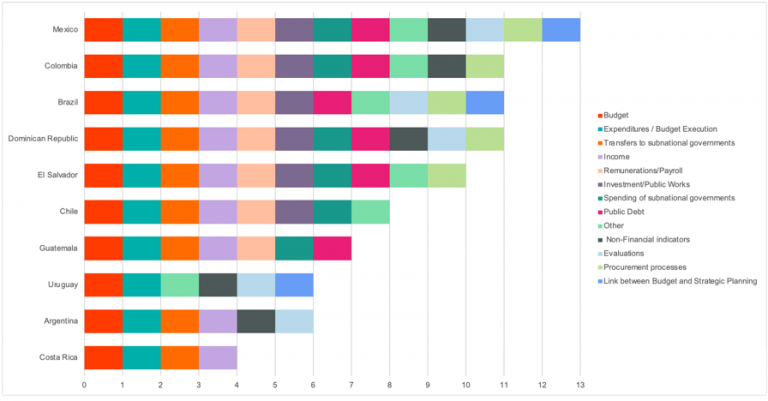
There are 12 basic fiscal policy areas that FTPs generally cover: budgets; income/ revenue; expenditure/budget execution; remuneration/payroll; procurement processes; transfers to subnational governments; infrastructure investment/public works; non-financial indicators; evaluations; link between budgets and strategic planning; spending of subnational governments (subnational government expenditure); and public debt. From the survey, we learn that:
-
- The most covered areas are: Budget; revenue; expenditure/budget execution; and transfers to subnational governments.
- The least covered areas are: Link between budgets and strategic planning; procurement processes; non-financial indicators; and evaluations.
- Internal information systems (software and hardware) mainly allow for manual-based upload instead of automatic processes, possibly hindering information sustainability.
Graph 1. Topics covered
How open is the information published?
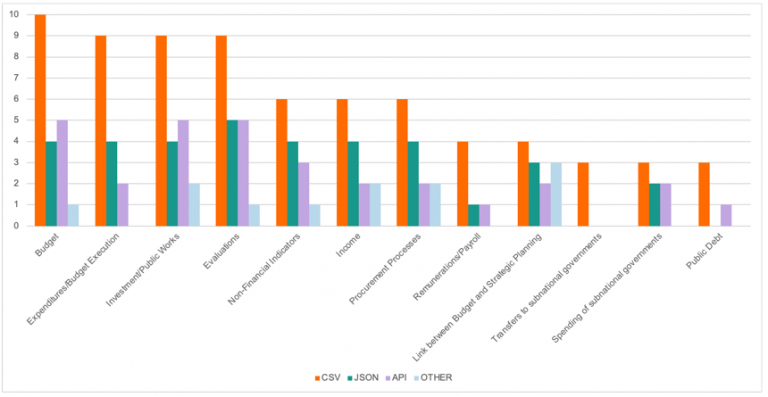
From Graph 1, we see that there is much work to be done in publishing information throughout the budget cycle. In addition, when thinking about openness, the usability of the information format used must be considered. Information should ideally be presented in machine-readable formats, allowing significant scope for reuse and distribution by anyone, anytime, anywhere. In this regard, the survey shows that:
-
- The use of CSV (comma-separated value) formats is a prevalent practice in transparency portals in the region. This format can be used without the need for proprietary software, and rates 3 out of 5 stars on the Tim Berner Lee’s data openness scale.
- The use of APIs (Application Programming Interfaces) is on the rise, as seen in Graph 2.
- However, on the downside, no country is publishing information on all of the 12 topics in open data formats.
Graph 2. Type of information format by topic
What communication channels are used?
Turning to the use of communication channels/data visualizations to facilitate the understanding of published information, the following practices are highlighted:
-
- We can all speak budgets! Training tools or resources, such as manuals, tutorials, and user guides, are widely used in the region’s FTPs, to assist in overcoming barriers to accessing information.
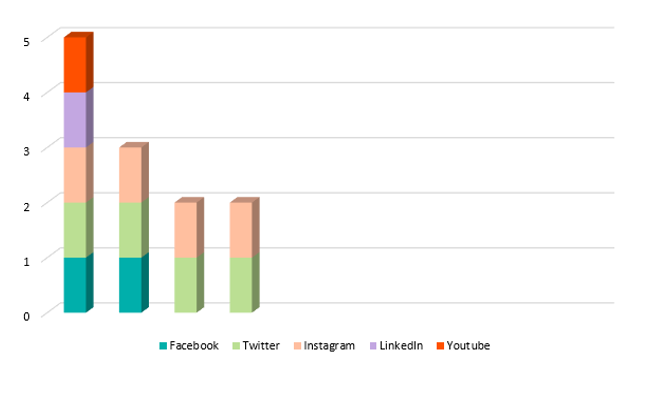
- Surveys/forms within FTPs are the most widely used means to communicate with users, as well as social media, particularly Twitter, as seen in Graph 3.
- The governments of Argentina, Brazil, Chile, Colombia, El Salvador, and Uruguay use the Data-Driven Documents (D3.js) library to manipulate and visualize their data-based content.
Regarding the audiences targeted, the survey finds that although there are efforts to inform, train and interact with audiences such as academia, organized civil society, journalists, executive institutions, and higher education students, the teams implementing FTPs could potentially benefit from engaging key groups in a closer manner. These include potential engagements with: specialists in data exploration to identify information patterns and promote the automatic or semi-automatic processing of data, providing for its enhanced analyzes; members of the legislative branch to keep them informed of spending trends assisting them in objectively examining the Executive’s reform and/or budget proposals; autonomous bodies, audit institutions, and external comptrollers enabling them to carry out in-depth analyzes either in real time or ex-post; and students enabling them to build the essential knowledge required to grow into informed, active citizens.
Graph 3. Social networks directly linked to FTPs
Interoperability and standardization: Pending agenda
How do we know if we on the right track?
The publication of data, visualizations, and other tools to inform the public is, like any action of the State, a governmental action that should have clear objectives and goals, to be sought and monitored. For this, it is necessary to contemplate how the quality of the implementation of an FTP can be measured, including in terms of impact, providing key information to guide improvements in subsequent iterations. According to the survey, this represents one of the biggest challenges for current FTPs:
-
- The monitoring of statistical browsing data, mainly through Google Analytics, is the main way that the use of portals is currently being measured.
- The tracking of search engine indexing statistics is not a common practice, and SEO positioning practices are not incorporated.
- The implementation of impact-related metrics is not yet seen.
Concluding remarks
For the GIFT network, this survey provides key information to guide collaboration and peer learning efforts. Given that it stems from the FTP implementers’ own assessment of the current state of their portals, activities stemming from it are likely to respond directly to their needs and goals.
As the survey shows, there has been significant forward movement in the region with regards to the FTP’s thematic comprehensiveness, format openness, the reach, and collaboration with users. Nonetheless, there is still work to be done, particularly on increasing sophistication in the gathering, standardization and publication of data processes to ensure sustainability as well as in, like in most policy paths, improving impact measurement.
For the GIFT network, these lessons form the basis for an agenda of activities that focus its peer learning and collaboration efforts on:
-
- Defining target groups for communication and participation activities;
- Budget literacy efforts to broaden audiences and encourage information co-creation and usage;
- Expanding communication channels;
- Citizen involvement (including citizen interaction and feedback); and
- Technology collaboration and visualization to standardize the publication of information, encourage automation and promote sustainability.