Nobody said it was easy! We all knew it, but still some of us (including me) might have underestimated the challenge of putting fiscal information out in the open.
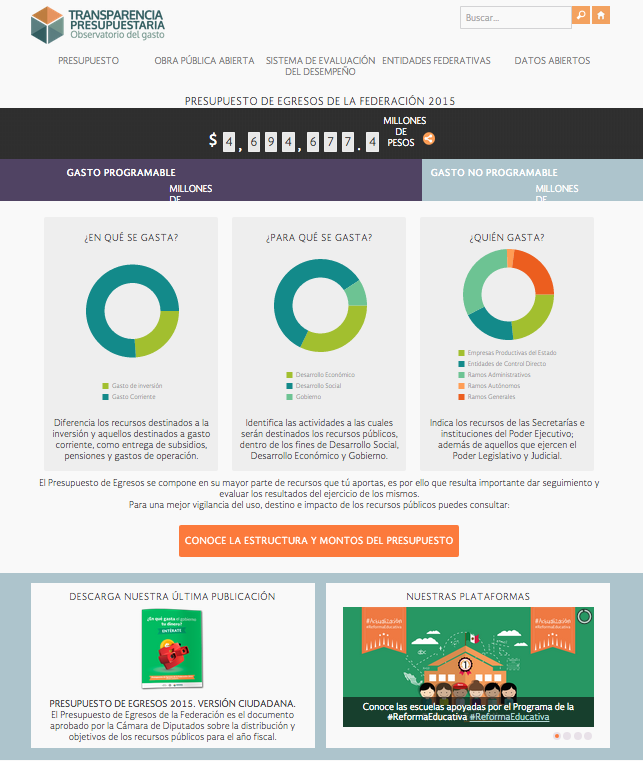
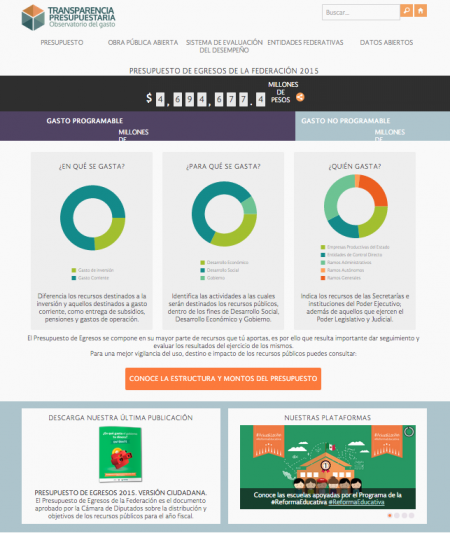
I started working in the Ministry of Finance in Mexico when the Budget Transparency Website had just been launched. The website had little information and was manually updated which created constant problems in presenting the latest information, but still it was an honest effort to initiate fiscal transparency and moreover, an innovative one since information was for the first time presented in simple language. This effort already helped Mexico to be considered as a country that presents “Significant” budget information, according to the Open Budget Index of 2012 of the International Budget Partnership.
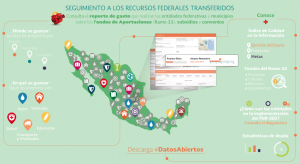
After a few years, that effort with huge potential has gone a long way, in it’s latest phase (some of us consider it phase 4)  now presenting more than 2,000 data sets in open formats, has been connected to internal systems for automatic and error free update and displaying information in interactive manners such as maps and animations to attract both the specialized researchers and organizations and non-specialized citizen interested in public affairs. With the new phase of the website (www.transparenciapresupuestaria.gob.mx) the visits were more than tripled (measured with Google Analytics) and as a result informed discussions over budget topics, as well as similar platforms and studies with inputs from the site increased.
After this process, the intention of this post is to share the lessons I learned, which do not reflect others reflections than my own.
- A little can go a long way. Sometimes starting these efforts means not having as much information out there as we would like to. In many cases the information is not available, is not in the formats we require it or we don’t have access to it, it can also be that at the moment we don’t have the technological solution to make open certain information. It might not seem ideal, but it’s always a good starting point for a phase 1, which doesn’t mean that a phase 2 and 3 won’t follow.
- Understand both the technological solution that contains the information and what the information says. So many beautiful platforms out there, so many options, and how are we supposed to decide what is best if we don’t understand the nature of the information that we are publishing?
- Know your allies. Sometimes, and specially at the beginning not all areas will be prone to opening up information, the public servant sometimes sees himself as the information keeper and making it publicly available feels like a huge responsibility. Find the transparency champions that will give part of their time explain the nature and structure of the information they manage and will help in publishing. Consider that all information will not be located in the same area, but once some information is open others will follow.
- It doesn’t need to be costly. In international meetings with the region one of the constant questions has been how can we pay for an initiative of this magnitude?
-First of all, an investment has to be made in the initial development of the platform if the government doesn’t have the personnel to implement this technologies, but many open source website administration options are also available. Being creative is also an option, launch a hackathon, contest or whatever you can imagine that involves open innovation, this will also have the benefit that potential final users will be involved in the development.
-Secondly, sites that are correctly linked to the information sources require less administration. Relying on manual updates requires a lot of working hours and therefore personnel, so plan ahead how updates will be performed. The team can be small and more focused. This brings us to number 5
- Connect the back-end to as many databases as you have in the front-end. Reprocessing data to publish will bring up human errors, which entail big damage on users trust of the information aside from the already mentioned problems to keep information up-to-date.
- Rely on civil society organizations. While having an important sample of users will be important, specially when the platform is already being piloted, organizations can help determine with which information to start with. Later on with the use of the site information increase can be adapted according to the demand preferences.
Staying close to your audience will also keep you updated of new technologies and users interests, so making time to attend hackathons, data expeditions, treasure hunts which are usually held during the weekends, pays off.
- People care about what’s close to them. Fiscal information can seem very abstract to most citizens, numbers and tables, and so they can be uninterested in using the information. From the statistics of use and information requests, we consistently found that the public was specially interested in local governments ex
 penditures. Most of the times the requests didn’t spell it all the way, but an analysis of the information derived in this constant. Think about it, it makes sense, we usually want to know if a new road will be built in our community rather than how many roads will be built in the whole country and if the hospital near to where we live will have enough resources for the so needed maintenance.
- Keep it simple. Fiscal information is already too much and technical enough, so trying to keep titles short and concise will make it easier to swallow. As technical experts we feel the need to disclose all the correct ways to interpret the data as well as all details, this is not wrong but it can be located inside of the documents or databases (in the metadata perhaps), therefore the interested users will find all the required information without overwhelming the beginner.
- Track performance. These types of initiatives are usually always unfinished business; keep your mind open to act in an iterative manner. Statistics will help you know not just how many people are entering the site, but also where they are clicking more, how long they’re staying and if important information is going unnoticed. One of the not-so-known but very insightful features is the conversions which lets you establish goals on the site to try alternative view and information architecture and the choose the best one to achieve your goals. My personal favorite tool is Google Analytics, which gives a lot of tracking options that may suit your needs, plus it’s free so no government purchase is required, nevertheless there are tons of alternatives to Google.
- Don’t underestimate the importance of a good design and communications. After several efforts of economists, including me, and political scientists trying to make appealing messages and images with modest results, designers committed with transparency came to form part of the team, which resulted in more attractive contents and engagement. From the old version of the website to the new one, the same contents began to be noticed, which finally helped boosting the visits and decreasing bounce rate.
As mentioned before, this post only intends to be an expression of my experience and what I’ve learnt from international forums, so go ahead and share your own experiences.

