

After two years of operation, Austria’s Open Spending portal www.offenerhaushalt.at covers 40% of all municipalities and won several awards. Currently it is shortlisted for the World Summit Awards as one of 97 best products among 386 nominations from 86 countries.
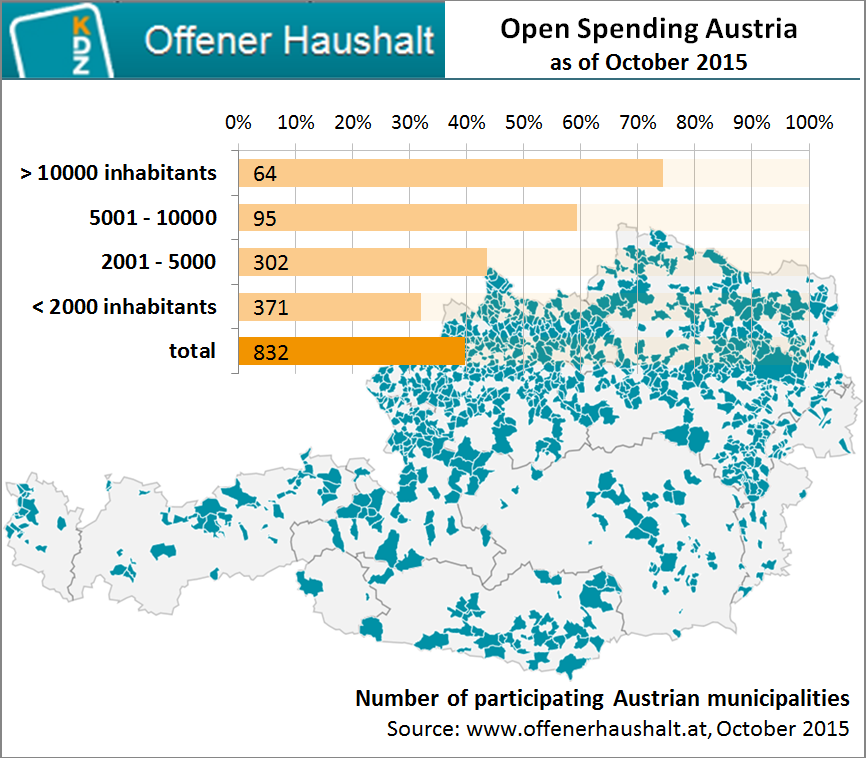
40 percent of Austria’s municipalities have joined the portal
Two years ago, on October 7th 2013 the Centre for Public Administration Research (KDZ) launched an open spending portal in Austria holding the spending data of all 2,100 municipalities at www.offenerhaushalt.at.
As of October this year, more than 830 (40%) have published their data, and more join in every day.
Each mayor has been sent login credentials enabling him or her to view and explore their own municipality’s spending data from 2001 to 2014 and with a few clicks release all data and visualizations on the portal for everyone to see and use.
The portal not only makes 14 years of spending data available online, it also provides several types of interactive data visualizations that make it easier for both local government officials and citizens to understand municipal budgets. The main visualizations available for each municipality are:
- Tree map of spending data according to political (functional) classifications (i.e., where does the money go?) including the corresponding economic classifications (i.e., what are the types of expenses?);
- Line chart with detailed view of the budgets over a 14-year timeline;
- Line chart of the debts and liabilities;
- Donut chart of the use of 1,000 euros of tax money;
- KDZ Quick test: a systematic approach of the financial soundness of the municipality according to 5 sub-indicators displayed in bar charts;
Interactive Network Visualization of Salzburg’s Grants and Subsidies
In a joint project of KDZ and the city of Salzburg, a specialized data set has been put together and visualized in form of an interactive network graph: the details of the grants and subsidies the city approves each year including the recipient. This way details of financial transfers can be shown as well as multiple transfers from different budget sources/departments. Colored nodes represent the topic of the grant (e. g. culture, sport, education) and the white nodes represent individual recipients.
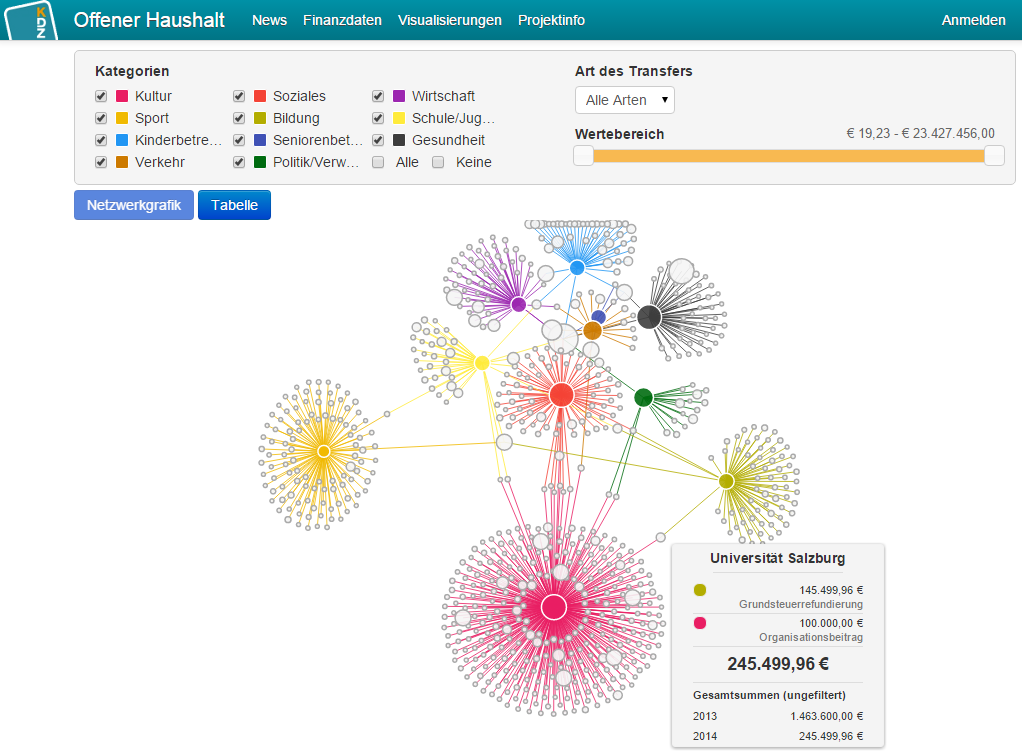
Financial transfers of the city of Salzburg to the University of Salzburg in a network visualization
Around 5.000 user sessions a month happen on the portal with an average view time of over three minutes. Many municipalities have taken the opportunity not only to use the features of the platform, but also to pro-actively inform their citizens about their budget. They are supported by the platform by providing special iFrame versions of the visualizations to make it easier to integrate them in the municipal websites. The city of Vienna has launched a special initiative Wien 1×1 www.wien1x1.at with more than 10 events where the Executive City Councillor for Finance explains the budget and answer questions together with financial specialists of the city administration.
The platform was initiated by KDZ, an Austrian NGO with sound knowledge of public finances: It was developed by Interactives using open source software (Drupal, D3.js).